I’m always looking for workshop methods that work. I have some favourites, but workshop facilitation is full of uncertainty. Nearly always, modification is needed, and most planned activities work better when we’re willing to stay loose. This time, the situation called for something completely new.
We needed something to cut through the noise. More than just a roadmap, we wanted to see relationships between parts in strategy. These parts included more than just software products. Operations, technology platforms, partnerships, business acquisitions, and software products all needed a place on the map. We wanted to create a visual model to show a single view. One reference for many teams.
All things considered, our visual model needs to:
- Map relationships between all initiatives in a programme
- Serve as a single view of strategy for many teams
- Show both tactical and strategic activity in the same view
- Show software initiatives alongside other kinds of work
- Be easy to understand and update
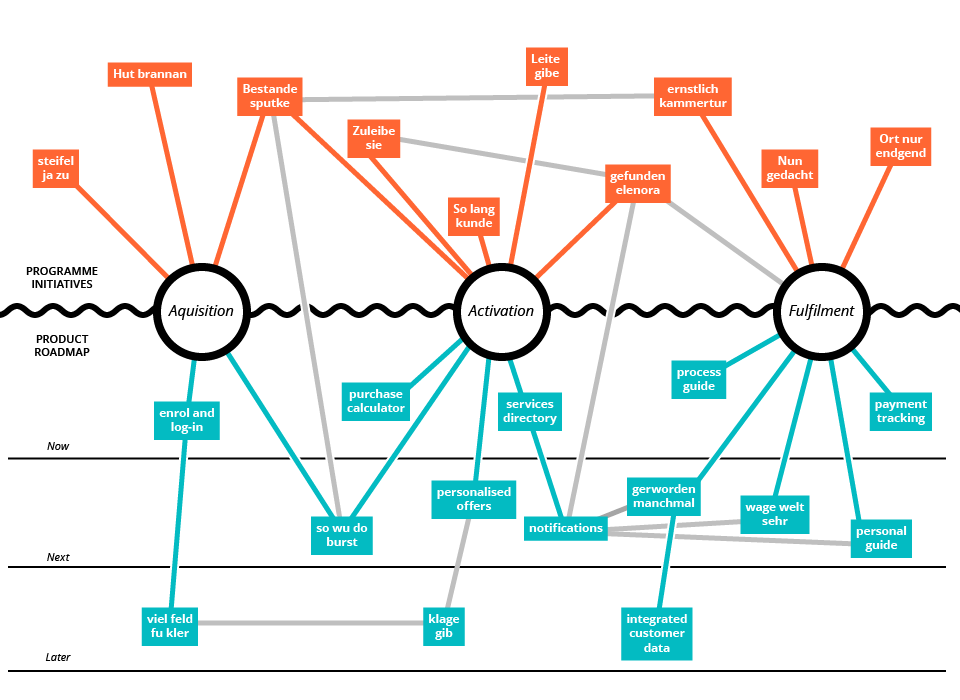
We dreamed up the Strategy Constellation Map

Let’s take a look at each part of the map in more detail.
Business Objectives
The map above shows business objectives representing a revenue funnel. The first two are about attracting and activating new customers. The third objective is about successful fulfilment of service – which in this case correlates with revenue generation. Your business objectives are probably different, but you get the idea.
When organised this way, it’s easy to see all the things that contribute to an objective in one place. Scanning across the map helps us define ‘thin slices’ of value. That is, small chunks of work that deliver tangible benefit when done together. This is the work you want to do first.
If you’d rather focus on just one objective, the map still helps. All relevant entities are shown together for easier prioritisation.
Product Roadmap
Here, product team can see how the work they do maps to the bigger-picture strategy (above the waterline). It’s an exploded view showing the roadmap for each item in the programme. The roadmap shows release horizons. Each horizon includes prioritised release candidates.
The product roadmap shown above has three release horizons:
- Now: Minimum functionality for basic provision of service. Some may call this the MVP.
- Next: Optimisation for a better customer experience.
- Later: Items for further consideration at a later time
Programme Initiatives
Above the waterline, all initiatives that make up programme of work are shown. These could be other products or services, changes to business processes, technology simplification, partnerships, new business models, and so on. Detail is less important. What we want to see is how these packages of work correlate with business objectives.
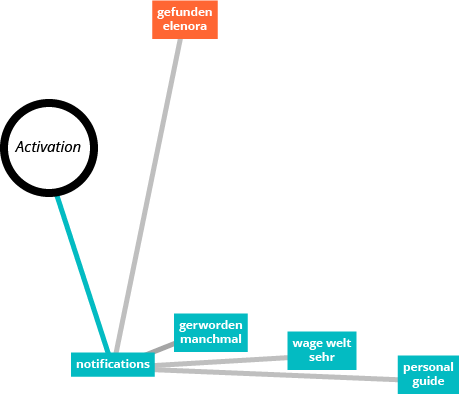
Visibility is the main goal here. Showing relationships makes it easier for teams to collaborate. And, it also reduced duplication. For example, a team working to optimise customer activations can easily see adjacent or related activity in the visual model.
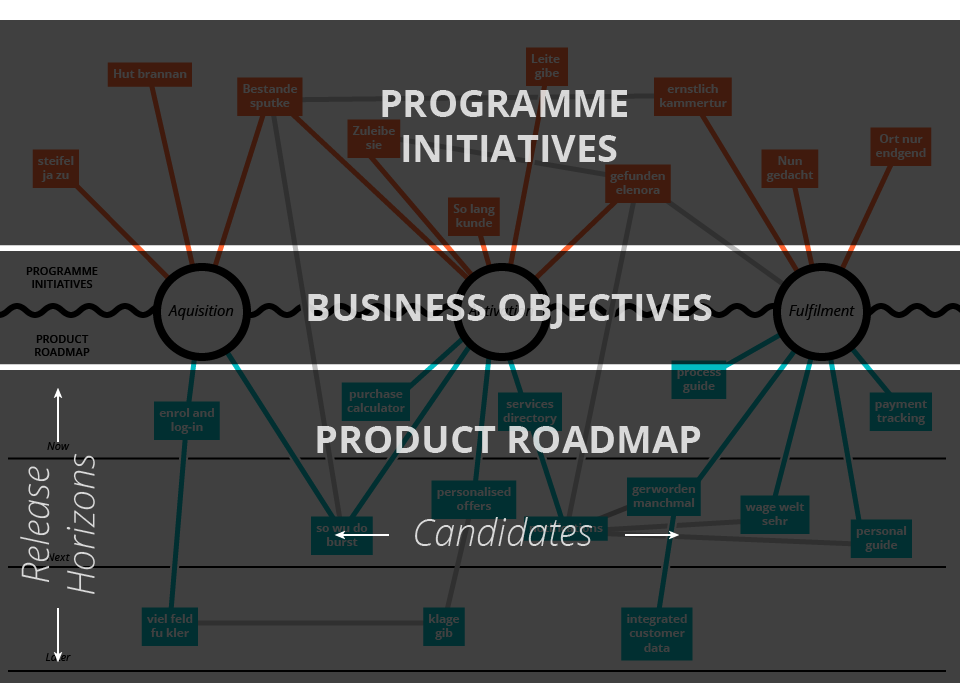
Bringing it all together
Constellation maps connect product-level strategy to a programme-level view. Mapping theses relationships together with business objectives, we achieve a single view. Product teams can ‘look up’, and see the broader context of what they’re working towards. It’s just as useful for strategy teams to ‘look down’ for a snapshot of how product-level initiatives contribute to the bigger picture.
Limitations
These are great for product teams, because one-to-many relationships are clearly shown. One product, mapping to many entities in a big strategy. However, many-to-many relationships are not so easy. Things above the waterline (programme initiatives) may have a relationship with many entities in several product roadmaps. That’s hard to show in a single view.
Constellation Maps work best when there are a handful of business objectives. Let’s say six or fewer. Any more than that, and mapping between entities becomes a bit silly, visually.
They’re strongest as a visual model. For ongoing management of scope and dependencies, these maps would surely become cumbersome over time. Especially if there are many product roadmaps within one programme of work.
If this a useful visual model for you, I’d love to hear your thoughts in the comments!